Bunbury The Wall Wind Stats
- Forecast
- Maps
- Live
- Weather State
- Spot Information
Wind Stats



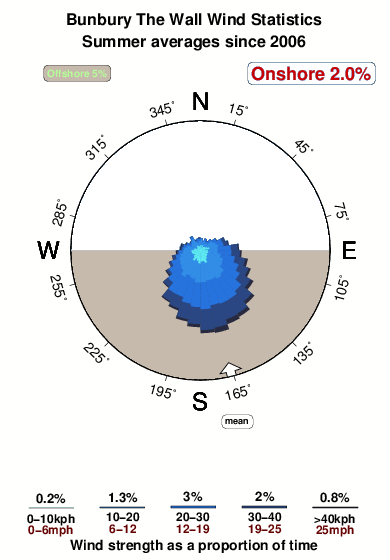
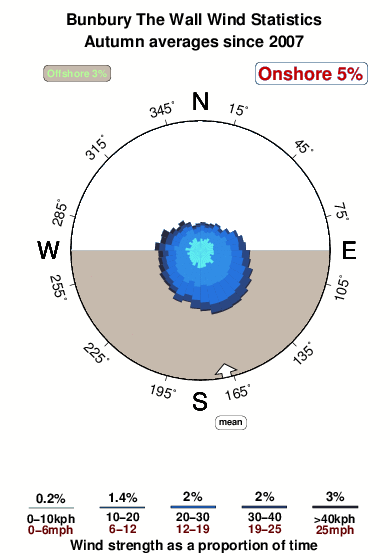
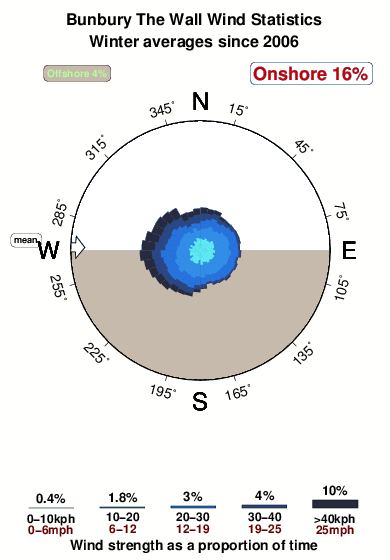
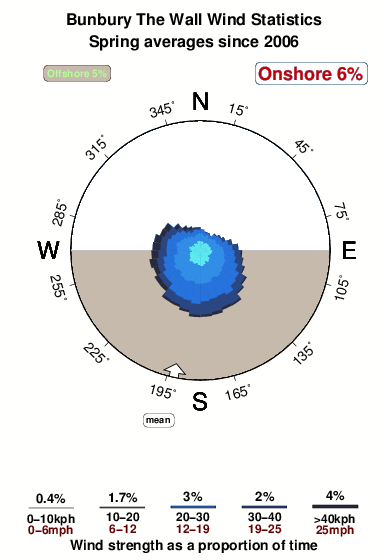
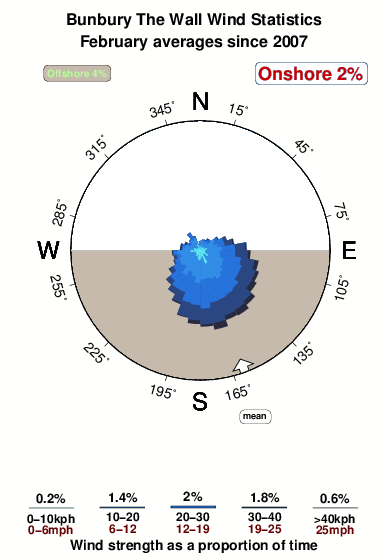
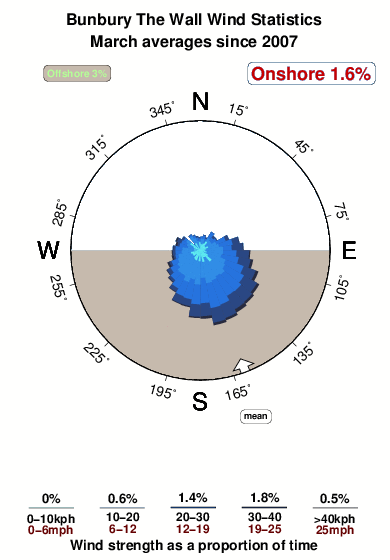
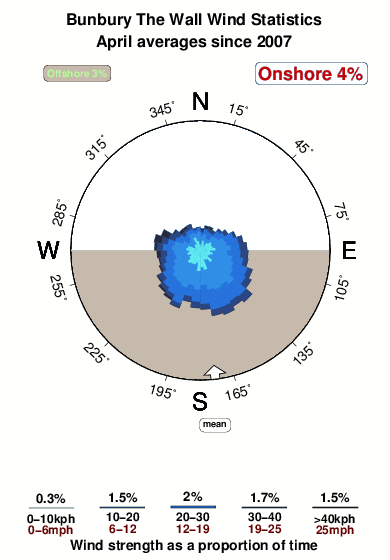
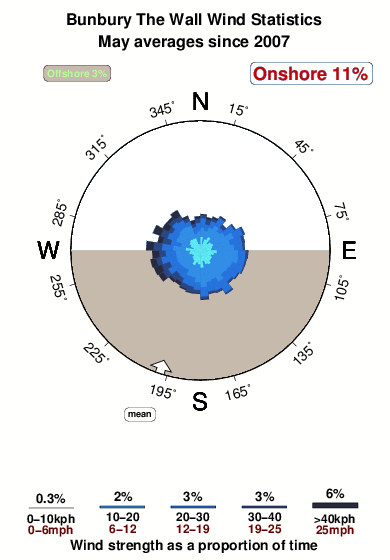
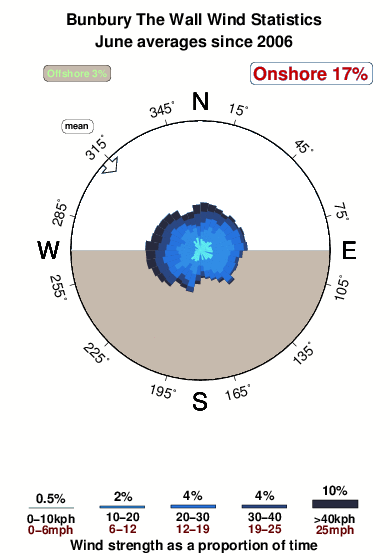
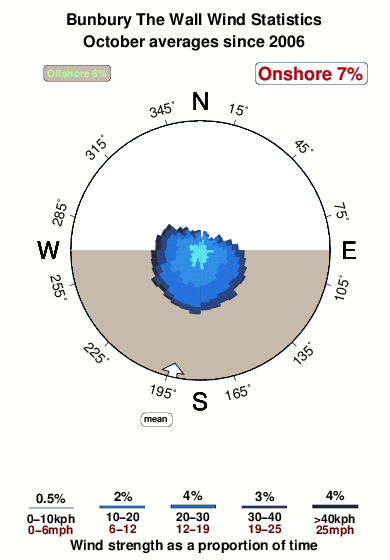
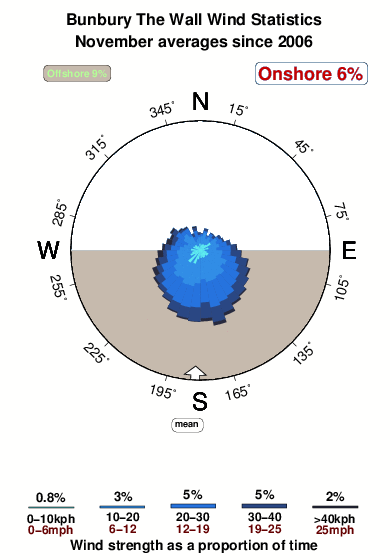
The rose diagram illustrates how frequently and how strongly the wind blows from different directions through a typical September. The longest spokes point in the directions the wind most commonly blows from and the shade of blue suggests the strength, with the darkest shade of blue strongest. It is based on 3360 NWW3 forecasts of wind since since 2006, at 3hr intervals, for the closest NWW3 model node to Bunbury The Wall, located 64 km away (40 miles). There are too few recording stations world wide to use actual wind data. Invevitably some coastal places have very localized wind effects that would not be predicted by NWW3. According to the model, the dominant wind at Bunbury The Wall blows from the W. If the rose graph shows a fairly circular pattern, it means there is no strong bias in wind direction at Bunbury The Wall. On the other hand, dominant spokes illustrate favoured directions, and the more the darkest shade of blue, the stronger the wind. Spokes point in the direction the wind blows from. Over an average September, the model suggests that winds are light enough for the sea to be glassy (the lightest shade of blue) about 0.4% of the time (0 days each September) and blows offshore just 3% of the time (1 days in an average September). During a typical September winds stronger than >40kph (25mph) are expected on 2 days at Bunbury The Wall




 Nearest